Health researchers (in full-time equivalent) per million inhabitants, by WHO Region (first set of charts)
The number of researchers in the fields of health and medical sciences ("health researchers") are collected, by country, from the United Nations Educational, Scientific and Cultural Organization (UNESCO) and Eurostat, the statistical office of the European Union.
These numbers are analysed below using the data for the most recent year since 2010. (Note: not all countries have reported data on this indicator).
See also:
What you see
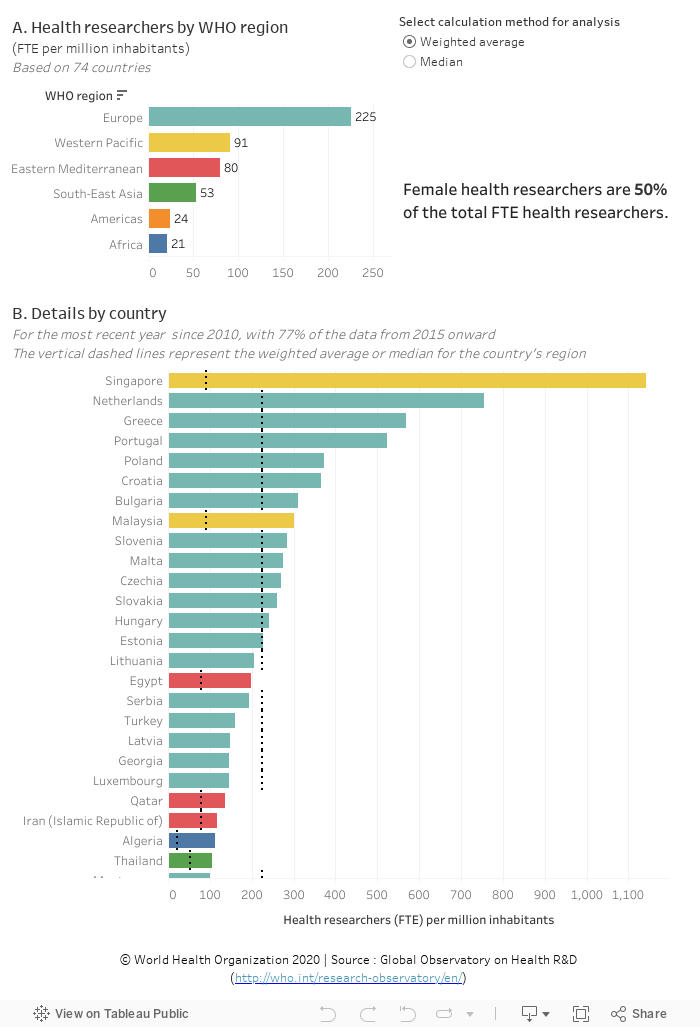
The data visualization above compares the number of full-time equivalent (FTE)1 health researchers2 per million inhabitants by country and by income group.Weighted averages and medians for FTE health researchers (chart A) and females as a proportion of all FTE health researchers (top right) are provided. (To see the data using either of the two calculation methods, select the desired method from the two options above the charts).
The weighted averages are derived from 74 Member States for which data are available. Data need to be interpreted cautiously because of the number of missing observations, especially from countries known to develop and publish health research.
Points to note:
- Disparities in scientific capacity between income groups are significant (chart A).
- The high income group of countries has approximately 73 times more FTE health researchers per million inhabitants (363) than the low income group of countries (5) (chart A), ranging (across the 74 countries) from 1142 in Singapore to 0.2 in Zimbabwe.
- Based on the data from the 74 countries, although female researchers account for half of the FTE health researchers, the proportion ranges from approximately 53% in high income group to only 24% in the low income group. (Click on a region on chart A to see the region-specific % -- top right.)
To explore the data further
- Select an income group in the top chart to filter countries within that income group ( income group averages are symbolized by the dashed vertical line in the bottom chart). For example:
-- Selecting the low income group, and then hovering the cursor on the country bar of interest (chart B), shows that Burkina Faso has approximately 4 times more FTE health researchers per million inhabitants (22) than the weighted average for this income group (5).
-- Selecting the high income group shows that six countries exceeded the weighted average (363) for the countries in this group , in the top two are Singapore and the Netherlands where 1142 and 755 FTE health researchers per million inhabitants reside, respectively.
- Click "undo" or "reset" (near the bottom of the page) or click the same element again to undo a selection.
Data sources
1 The full-time equivalent (FTE) of R&D personnel is defined as the ratio of working hours actually spent on R&D during a specific reference period (usually a calendar year) divided by the total number of hours conventionally worked in the same period by an individual or by a group.