Official development assistance (ODA) for medical research and basic health sectors per capita, by recipient country, January 2018
Published:January 2018
The Official Development Assistance (ODA) data are collected from the Organization for Economic Co-operation and Development (OECD) and are reported below for the year 2016 in US$ (not all countries have reported data on this indicator).
See also:
What you see
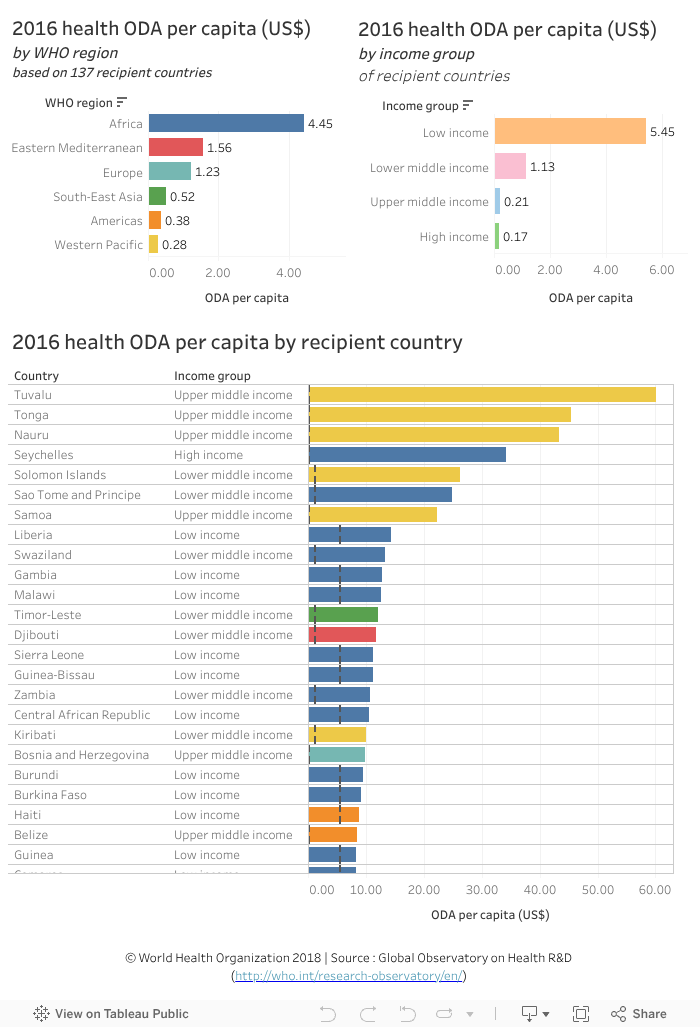
The data visualization compares 2016 health ODA per capita in US$ by recipient country (bottom chart). Weighted averages are provided by WHO region and country income groups (top charts).
Points to note:
- Weighted averages of health ODA per capita are derived from 137 ODA recipients countries for which data are available. Due to the missing observations, caution is needed in interpreting the numbers.
- Africa (top chart, left) and countries in the low income group (top chart, right) received the highest average health ODA per capita (4.45 US$ and 5.45 US$, respectively) compared to the other regions and income groups.
To explore by country data (bottom chart) and differences with income group weighted averages (the income group weighted average is symbolized by vertical dashed line and countries are color-coded by region):
- Select a WHO region (top chart, left) or an income group (top chart, right) to compare countries according to the category of interest. For example:
-- Selecting only Africa shows in the bottom chart that Seychelles (a high income country) received the highest amount of health ODA per capita (34.17 US$) compared to the other countries in this region with almost eight times more health ODA per capita than the weighted average for this region (Africa: 4.45US$) and 200 times the weighted average for this income group (high income: 0.17 US$). Seychelles is among four countries in the high income group that received health ODA in 2016; the other countries are Palau, Uruguay and Chile (undo the selection of Africa in the top left chart and select high income countries in the top right chart).
-- Selecting only the low income group shows in the bottom chart that while Liberia received almost three times more (14.27 US$) health ODA per capita than the weighted average for this income group (5.45 US$); Democratic People Republic of Korea, at the bottom of the list, received 6 times less with 0.9 US$.
-- Selecting only the upper middle income group shows in the bottom chart that Tuvalu, the country with the highest health ODA per capita in this group, received 286 times (60.03 US$) the weighted average health ODA per capita for this income group (0.21 US$). - Hover the cursor on a bar in a graphic to see more information in a popup window.
- Undo the selection by clicking ‘undo’ or ‘reset’ near the bottom of the page or by clicking the same element again.
Data sources