Collaborations (between institutions) that resulted from grants for biomedical research
Published December 2020
Since 2012, World RePORT has collected grants data for biomedical research from a growing number of major funders of health research. Presented here is information on collaborations resulting from direct (primary) grants awarded in 2017 by 7 funders that reported to World RePORT. (See more about the scope and limitations of World RePORT below.)
See also:
What you see | Scope and limitations | Data sources | Current version
What you see
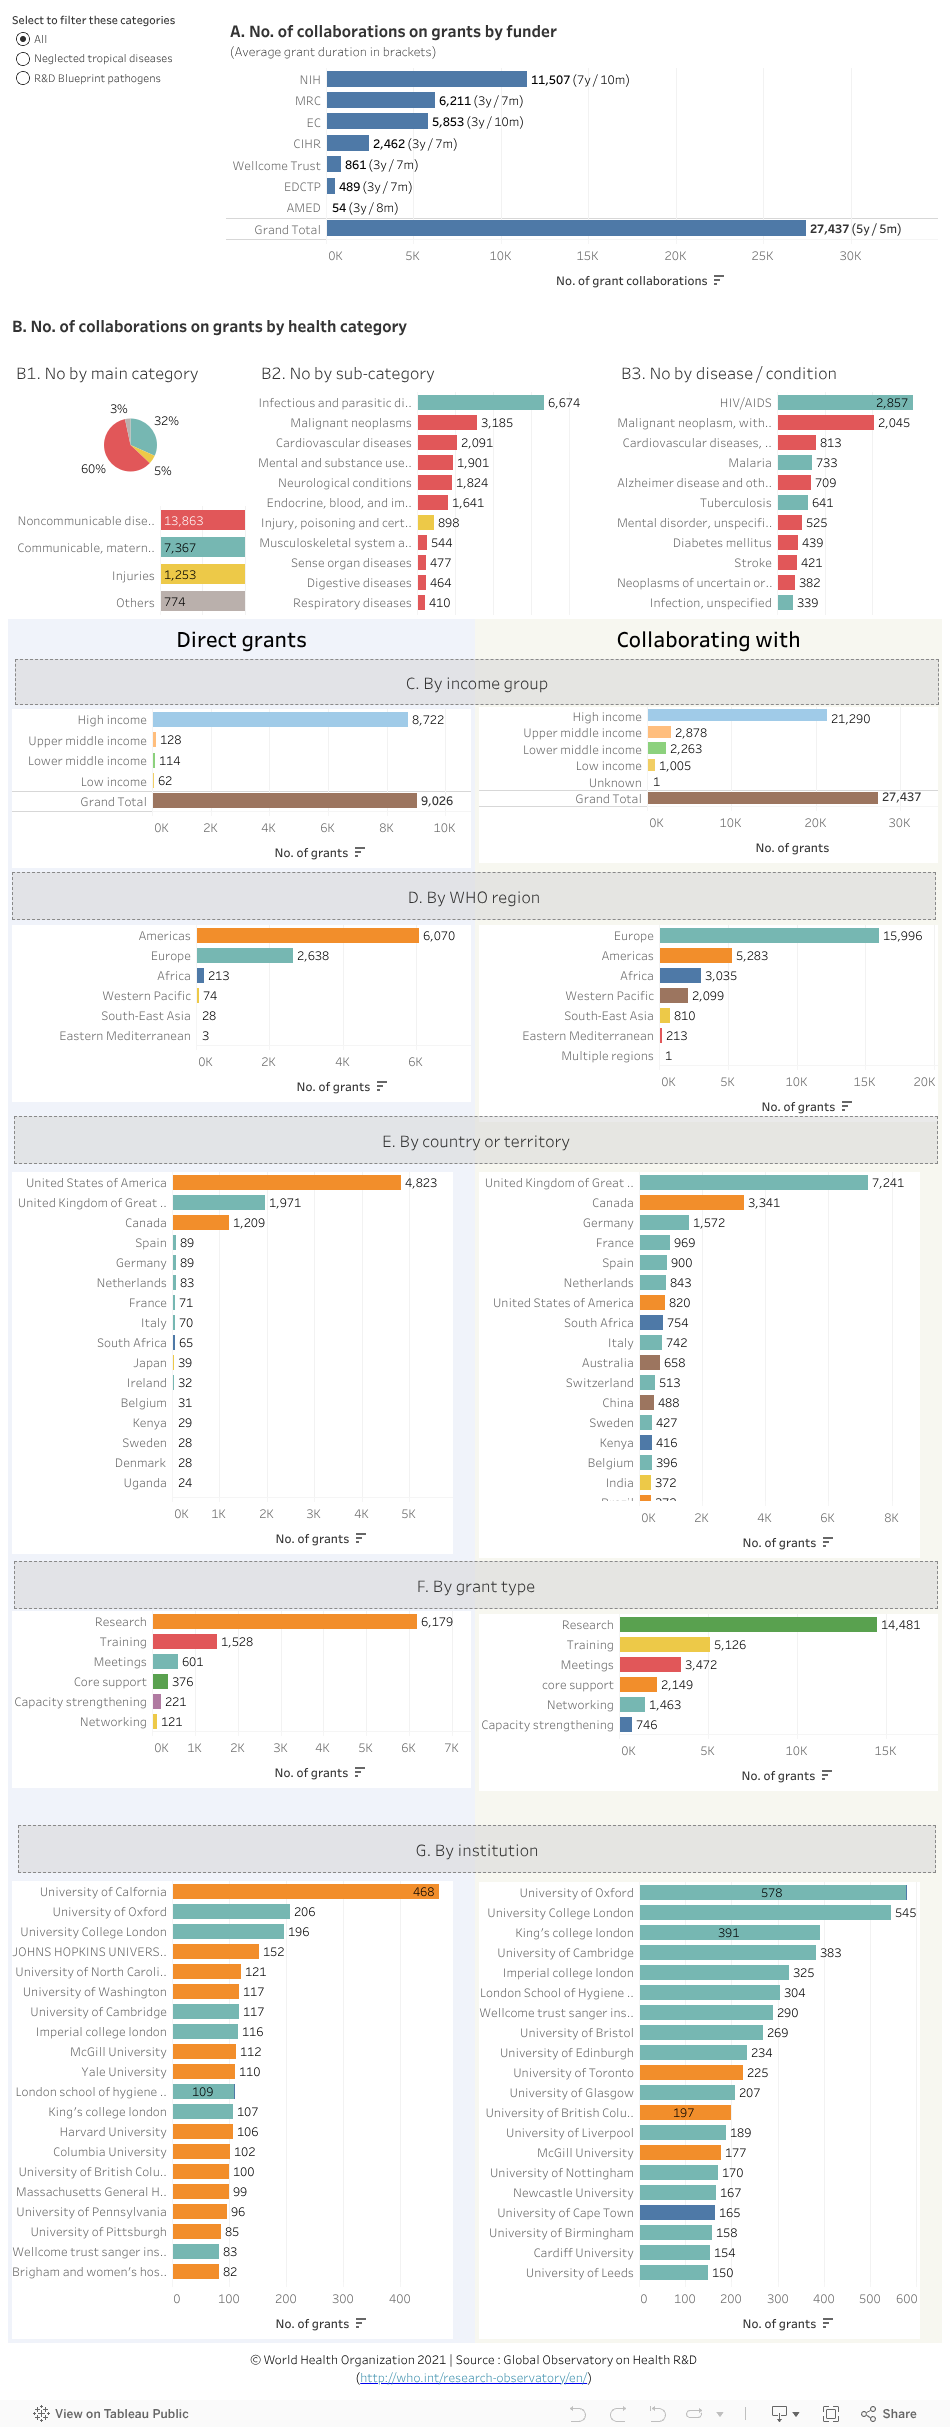
The data visualization shows the nature of collaborations between research institutions that resulted from grants for health research from major funders in 2017. Note: (i) Not all direct grants by these funders resulted in collaborations and (ii) one direct grant may have resulted in one or more collaborations.
The first two charts show how many collaborations resulted from direct grants by funder (chart A) and how these grants that resulted in collaborations are divided according to health category (chart B). Charts C-G compare direct grants to the collaborations linked to them with respect to country income group, WHO region, country, grant type and institution.
Grants for the WHO list of neglected tropical diseases or ‘R&D Blueprint pathogens’ can be filtered by clicking on the respective circular button at the top left of the data visualization.
Points to note:
- More than half 55.1% (11,507) of collaborations resulted from direct grants awarded by the United States of America’s National Institutes of Health (NIH); this institution also gave the highest average grant duration (approx. 8 years) (chart A).
- 60% (13,863) of collaborations were for research on noncommunicable diseases, followed by communicable, maternal, and perinatal conditions (32%;7,367) and injuries (5%;1,253) (chart B1).
- Of all grants on noncommunicable diseases (select this disease in chart B1), the highest number of collaborations were for research on malignant neoplasms (3,185) (chart B2).
- Of all grants for neglected tropical diseases (select this category at the top left of the visualization), the top three disease/conditions on which research collaborations occurred were dengue (150), leishmaniasis (97) and cryptococcosis (59) (see chart B3).
- Of all grants for R&D Blueprint pathogens (select this category at the top left of the visualization), the top three disease/conditions on which collaborations occurred were research on Zika virus disease (133), followed by Ebola virus disease (97) and Crimean-Congo haemorrhagic fever (18) (see chart B3).
- 96.6% (8,722) of direct grants that resulted in collaborations had been awarded to recipients in high income countries (chart C, left). Of these, 79.2% (20,930) collaborations were with others in high-income countries. (select ‘high income’ in chart C, left and then see chart C, right). In fact, for each income group, collaborations were most likely to be with others in the same income group. Thus, for example, grant recipients in high income countries were most likely to collaborate with others in high income countries.
- Overall, the United Kingdom is top of the list of countries with which grant recipients collaborated (chart E, right).
Exploring the data further
- Select a funder, a WHO region, a country or any other category (by clicking on a bar in a chart or a cell in a table) to filter data for the desired selection in the other charts.
- For example, selecting the United States of America, the top country that collaborated with others through its 4,823 direct grants (chart E, left), collaborations were mostly with institutions in Canada (1,452) followed by the United Kingdom (1,246) and Germany (733). (chart E, right).
- Hover the cursor on a data element (a bar or a cell) to see more information in a popup window (for example, percentages and other relevant categorizations). The popup information is updated automatically for any of the selections made by filtering the data in the previous step.
- Hold the ‘Ctrl’ key to select more than one option, for example two regions.
- Undo a selection by clicking the ‘undo’ or ‘reset ‘symbol near the bottom of the page or by clicking the same element again.
Scope, analysis and limitations of the data
Scope
- The World RePORT is hosted by the United States of America’s National Institutes of Health and managed through a steering committee of the agencies providing data.
- To date, the World RePORT includes data reported by 12 major funders of health research. Not all these funders report on a yearly basis. For example, only 10 of funders reported data for grants in 2017.
- The World RePORT data include direct (primary) grants provided to recipient institutions as well as collaborations with other institutions resulting from these grants (indirect grants administered by recipient institutions). This data visualization focuses on collaborations with the primary recipient institutions.
- Not all funders that reported data for 2017 grants are included in this analysis, either because they did not report collaboration grants or available information on direct grants that resulted in collaborations with other countries or institutions does not allow linking the collaborators with the recipients of the direct grants.
Analysis
- Automated data mining was used to generate information on the type of grant and health category using text-based data fields for each grant.
-- To determine the type of grant, synonyms for the type of grant categories listed in the data visualization were extracted from the title or abstract (if available) of the grant record.
--To assign a health category to each grant, the Observatory’s compiled list of disease synonyms was used as described below. The list was compiled using as a base the Unified Medical Language System (UMLS) and the International Classification of Diseases. This was complemented by synonyms drawn from the data, mostly to account for errors in data entry such as spelling errors or use of abbreviations.
-- An automated algorithm was applied to two data fields, the grant’s title and abstract, using the list of disease synonyms to generate the disease classification field used in this analysis. The algorithm stops if a match is identified using the title field, if not a match using the abstract field is pursued. The first match closer to the beginning of the text field was selected. This was considered the primary disease focus of the grant. It is possible that a grant has more than one disease focus; this is not captured in this analysis.
-- The algorithm was refined through various iterations and will continue to be refined in future updates but as with any automated algorithm, it is likely that some grants were not correctly matched. A full description of the methods and approach is available in this paper: Resource allocation for biomedical research: analysis of investments by major funders. - For the calculation of the average duration of grants, we assumed a 5-year renewal term for a continuous grant (no definite end date); this adjustment was applied to less than 1% of the data.
Limitations of the data
- For some funders, especially those with relatively new or fixed data collection platforms, the data do not accurately reflect the scale of research investments or collaborations between recipients of grants.
- This analysis only reports the number of grants. It does not reflect the volume of investments across countries or categories of funding. While investments data exist for some funders (such as the NIH), it does not yet exist in a standardized way across all reporting funders. This area is expected to be better addressed in future years as a result of the collaborative efforts among the reporting funders of the World RePORT to improve data collection and reporting standards.
- This analysis will be updated when new data becomes available; however, time lags with the scheduled updates by the data source are inevitable. Accuracy and completeness of the information is the responsibility of the data source, see terms and conditions of use.