Distribution of R&D funding flows for neglected diseases (G-FINDER), by source and type of funding
Published: July 2017
The product-related R&D funding flows for neglected diseases, and select viral haemorrhagic fevers (VHFs) are collected from the Policy Cures Research G-FINDER survey. This collects funding data from over 200 private, public and philanthropic organizations on product-related R&D and basic research and platform technology investments in 39 neglected diseases and select VHFs. See also analysis by disease and by funder country, funder, and recipient organizations.
See also:
What you see | Scope and limitations | Data sources | Current version
What you see
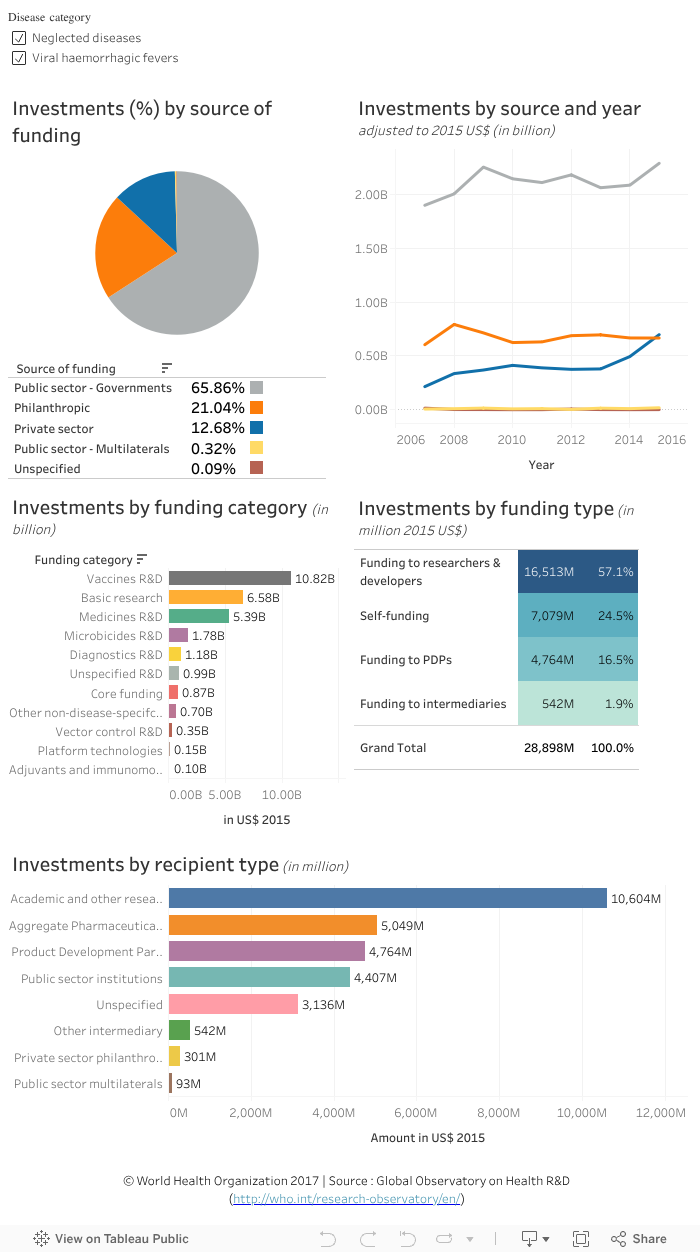
The data visualization illustrates the funding flows for neglected diseases and select VHFs by source of funding (top left chart), yearly trends in investments by source (top right chart), funding category (middle left chart), funding type (middle right chart), and by recipient organization type (bottom chart) for the period 2007–2015 (note: data on VHFs are available from 2014 only for Ebola virus disease and for 2015 for the other select VHFs, see list under scope below). The data in the years prior to 2015 are adjusted for inflation and presented in US$ 2015 (adjustment performed by the data source).
Data can be explored separately for neglected diseases or VHFs by ticking the box with the relevant disease category (top left).
Points to note:
The G-Finder survey data underestimate the total R&D investments for these diseases as reporting is incomplete and need to be interpreted cautiously due to the scope restrictions of the survey (outlined below).
Over the nine years of investments on neglected diseases (un-tick the ‘Viral haemorrhagic fevers’ disease category on the top left to filter):
-- A total of US$ 28.1 billion was spent (middle right chart), the largest share of funding
was by public sector governments (66%), followed by philanthropies (22%) and the private sector (12%) (top left chart).
-- Funding flows to researchers and developers was the top category for both public sector governments (69%) and philanthropies
(53%) while public sector multilaterals funded product development partnerships (PDPs) the most (88%) (click on a funding source listed in the top left chart to filter data in the other charts).
-- Public sector governments are the largest funders
for basic research (86%) with downward trend in investments since 2009 (click on basic research listed in the middle, left chart to filter data in the top charts).
-- Funding for vaccines R&D have also been predominantly financed by public
sector governments (65%), followed by philanthropies (22%), while the share of funding flows for medicines R&D is more evenly distributed among the three main sources of funding: public sector governments (35%), the private sector (34%) and philanthropies
(30%) (click on the funding category listed in the middle left chart to filter).
-- Academic and other research institutions received the highest share of funding, followed by product development partnership (PDP), and aggregate pharmaceutical
and biotechnology companies (37%, 17%, and 16% respectively; bottom chart -see information in popup window).
Over the two years of investments in VHFs (un-tick the ‘neglected diseases’ category on the top left to filter):
-- A total of US$ 795 million was invested in VHFs (middle right chart); the largest share of funding was from public sector
governments (63%), followed by the private sector (33%) and philanthropies (4%) (top left chart).
-- Investments from public sector governments recorded the highest increase between 2014 and 2015 (from US$ 0.12 to 0.38 billion; top right chart).
-- As shown in the middle left chart, 58% of investments were for vaccines R&D (US$ 0.5 billion), followed by 22% for medicines R&D (US$ 0.2 billion) and 10% for basic research (US$ 0.1 billion).
-- Aggregate pharmaceutical and biotechnology
companies received more than half of the investments in VHFs, followed by public sector institutions, and academic and other research institutions (57%, 19%, and 16% respectively; bottom chart).
To explore the data further:
- Select a source of funding, a funding category or other selections to filter the corresponding information in the other charts.
- To filter results for a different range of years, left click on the mouse and highlight the points on the trend line chart on the top right representing the year (or years) of interest.
- Hover the cursor on a slice in the pie or a bar in a graphic to see more information in a popup window.
- Undo a selection by clicking ‘undo’ or ‘reset’ near the bottom of the page or by clicking the same element again.
Scope and limitations
The data must be interpreted cautiously because of the specific scope restrictions of the G-FINDER survey (see link below for detail). The scope of the G-FINDER survey is determined by applying the following three criteria for neglected diseases. (R&D investments which do not meet these criteria are excluded.)
- The disease disproportionately affects people in developing countries.
- There is a need for new products (i.e. there is either no existing product, or improved or additional products are needed).
- There is market failure in developing these new products (i.e. there is an insufficient commercial market to attract R&D by private industry).
For some diseases, only R&D funding for developing-country specific serotypes/strains or products are included. For example, genotypes 4, 5, and 6 only are included for Hepatitis C. R&D funding flows for VHFs included Ebola virus disease only since 2014 with the addition of Marburg virus disease, Lassa fever, Rift Valley fever and Crimean-Congo haemorrhagic fever in 2015.
G-FINDER scope and restrictions
1. https://gfinder.policycures.org/PolicyCures/rdScope
2. https://gfinder.policycures.org/staticContent/pdf/ND_matrix.pdf