Gross domestic R&D expenditure on health (health GERD) as a % of total GERD
Published: October 2018
The gross domestic expenditure on R&D (GERD) and GERD in the health and medical sciences (health GERD) are collected from the United Nations Educational, Scientific and Cultural Organization (UNESCO), the Organisation for Economic Co-operation and Development (OECD) and Eurostat, the statistical office of the European Union. They are reported below using the most recent available data since 2010 by country (Note: not all countries have reported data on this indicator).
See also:
What you see
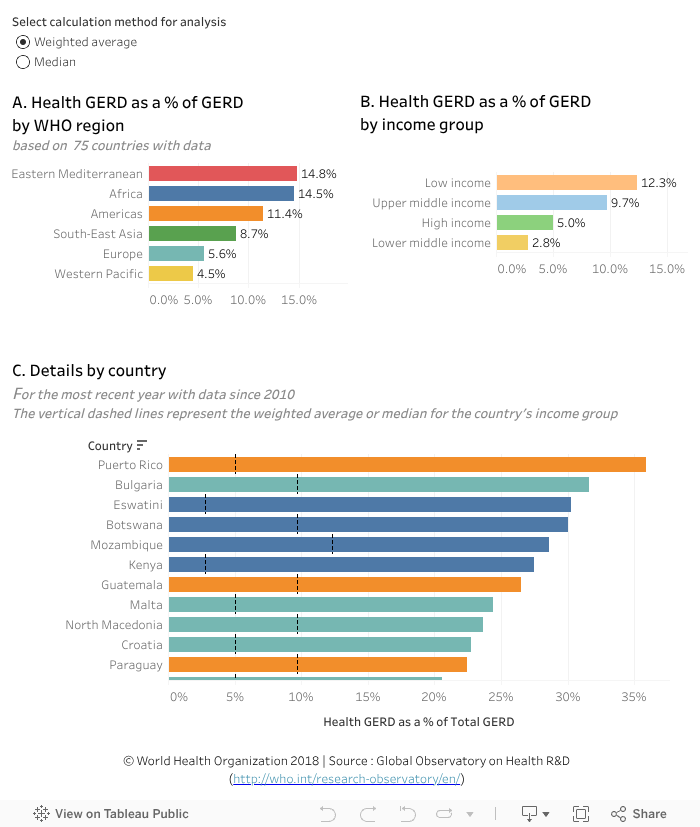
The data visualization above shows health GERD by country as a % of total GERD. Regional weighted averages and medians are provided by WHO region and by country income groups (charts A and B).
Points to note:
- The weighted regional averages are derived from 75 Member States for which data are available. They need to be interpreted cautiously because of the number of missing observations.
- The regional average health GERD as % of total GERD varies between 4.5% (Western Pacific) and 14.8% (Eastern Mediterranean). (chart A)
- Low income group countries allocated the highest % of their GERD to health, on average – 12.3% compared to 2.8% by lower middle income countries. (chart B)
To explore by country estimates and differences with regional averages (in the chart at the bottom -- regional average symbolized by vertical dashed bar):
- Select a region and/or income group in the top charts to filter countries according to those categories.
-- For example, selecting only Africa (in chart A), shows that Eswatini, Botswana, Mozambique, and Kenya allocated more than 20% of GERD to health (27%–30%), compared to the regional average (14.5%) and their respective income group average (see vertical dashed line). - After selecting a region, you can select an income group (in the top right chart) which will filter the countries belonging to this income group within this region.
-- For example, selecting low income countries within Africa (already selected in the previous step) shows that Mozambique (29%) , and six other countries in that income group, exceeded the average health GERD as % of total GERD for low income countries (12.3%). - Hover the cursor on a bar in a graphic to see more information in a popup window (year, total GERD in local currency, health GERD in local currency, health GERD as % of total GERD, regional/income level averages).
- Undo the selection by selecting ‘undo’ or ‘reset’ near the bottom of the visualization or by selecting the same element again.