Health researchers (in full-time equivalent), as a proportion of all researchers
Published: January 2021
The number of researchers in the fields of health and medical sciences (‘health researchers’) are collected, by country, from the United Nations Educational, Scientific and Cultural Organization (UNESCO) and Eurostat, the statistical office of the European Union.
These numbers are analysed below using the data for the most recent year since 2010. (Note: not all countries have reported data on this indicator).
See also:
What you see
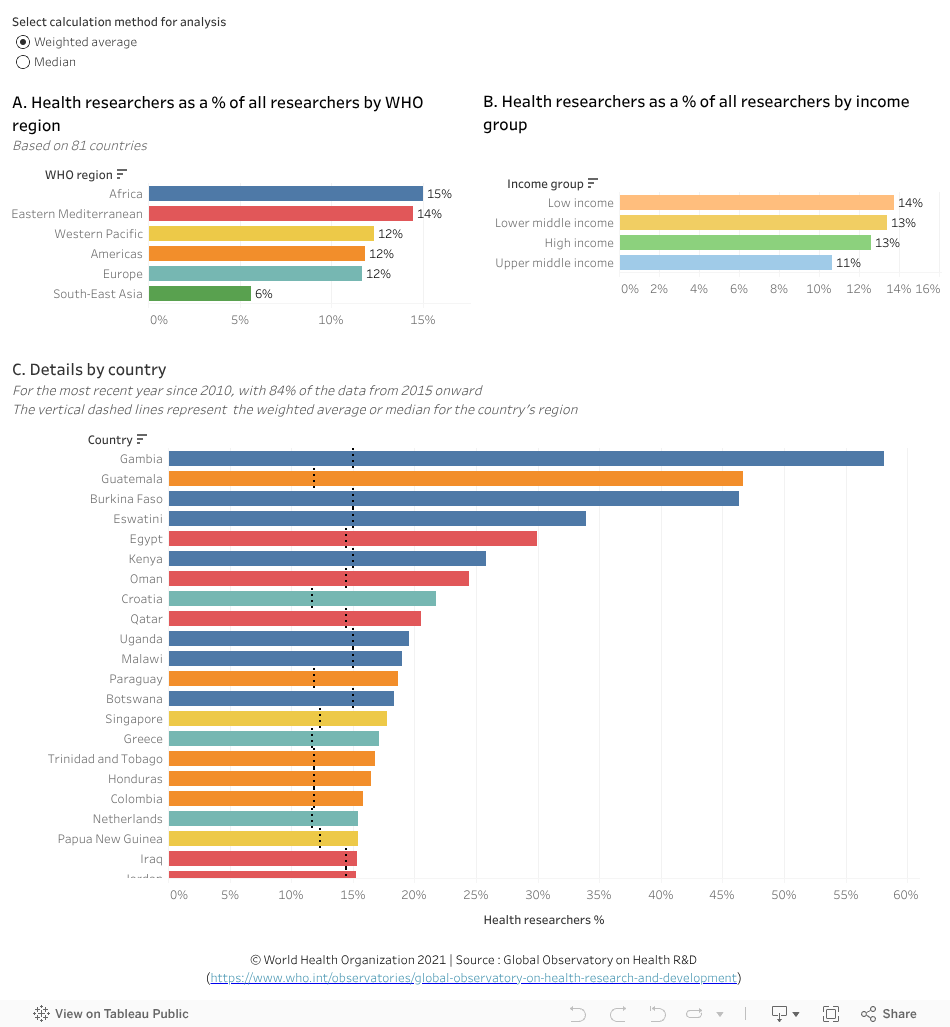
The data visualization above compares the weighted average of full time equivalent (FTE) health researchers1 2 as a percentage of all researchers by WHO region (Chart A) and by income group (Chart B). The bottom chart provides the percentage by country (regional group averages are symbolized by the dashed vertical line in Chart C)
- The data are derived from 81 Member States for which data are available. They need to be interpreted cautiously because of the number of missing observations.
- The weighted average of all researchers who are health researchers (in FTE) varies from 15% (Africa region) to 6% (South-East Asia region).
- Differences are smaller between income groups with the weighted average of health researchers (in FTE) as a percentage of all researchers in the low-income group slightly higher (14%) than in the other income groups (11%-13%).
- The top three countries with the highest proportion of all researchers who are health researchers (in FTE) are Gambia (58%), Guatemala (47%) and Burkina Faso (46%); they all exceeded their regional averages (Chart C).
To explore the data further
- Select a WHO region (Chart A) and/or income group (Chart B) to filter countries within that region and/or income group in the bottom chart: regional averages are symbolized by the dashed vertical line. ( note: the country bars in Chart C are colour coded according to WHO region).
- Hover the cursor on a bar in a graphic to see more information (e.g. country, year, total FTE health researchers, health researchers as a % of all researchers, regional average) in a popup window.
- Click "undo" or "reset" (near the bottom of the visualization) or click the same element again to undo a selection.
For example:
- Selecting only Eastern Mediterranean, then hovering the cursor on the country bar of interest (Chart C), shows that Egypt and Oman (30% and 24% respectively) both have a higher proportion of health researchers as a percentage of all researchers than the regional average (14%).
- Selecting Africa shows that of all researchers in Gambia, 46% are health researchers, compared to 15%; the average for the region.
- After selecting a region, you can select an income group (in chart B) which will filter the countries belonging to this income group within this region. For example:
-- selecting lower middle income countries within the Eastern Mediterranean region shows that Egypt (30%) is the only country (among three countries in that income group) exceeding the regional average (14%). - Selecting the low-income group displays the relevant countries with available data, and shows that most of the selected countries are from the African region.
Data sources
1 The full-time equivalent (FTE) of R&D personnel is defined as the ratio of working hours actually spent on R&D during a specific reference period (usually a calendar year) divided by the total number of hours conventionally worked in the same period by an individual or by a group.
2 Medical and health sciences (for R&D data) include basic medicine; clinical medicine; health sciences; health biotechnology; and other medical sciences.