Worldwide status of higher education institutions offering disciplines related to research for health in 2023
First published: January 2020
Last update: January 2024
Data on worldwide higher education institutions are collected from the International Association of Universities’ World Higher Education Database (WHED). WHED data reported below reflect the status as of December 2023. The data are derived from the 182 countries for which data are available.
What you see
The data visualization explores the worldwide status of higher education institutions that offered disciplines related to research for health in 2023 from various dimensions in three separate tabs, as outlined below (refer to the tabs at the top of the page):
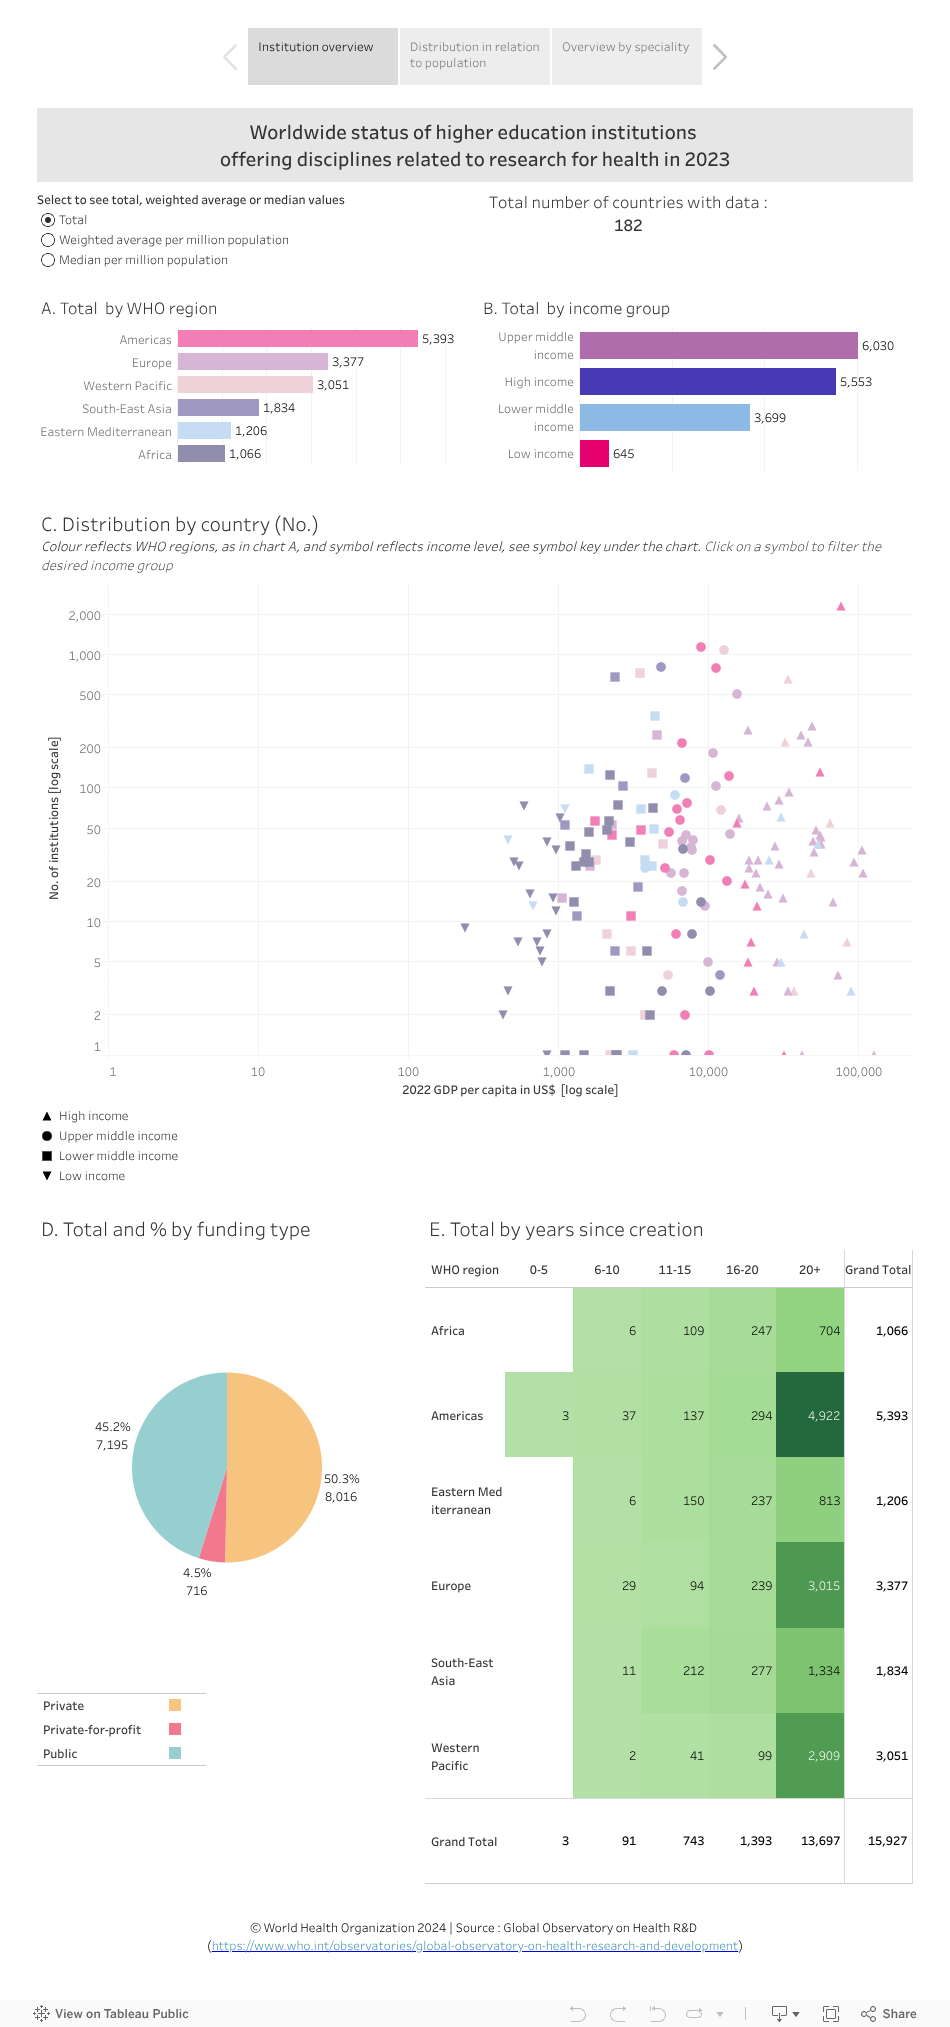
- Tab 1 - Institution overview: this tab shows the distribution of institutions by WHO region and by income group (charts A and B respectively; total, weighted average per million population and median per million population). Chart C shows distribution per million population by country in relation to the country’s GDP per capita; chart D shows total and % by funding type; and chart E shows years since creation.
- Tab 2 - Distribution in relation to population: in this tab, charts A and B both show the number of institutions per million people by country, plotted against GDP per capita. The size of the country income group symbol reflects country population size in chart A and reflects country population density in chart B. These charts respectively indicate whether country population size or population density influence the number of institutions.
- Tab 3 - Overview by speciality: Charts A and B show the same information as charts A and B in the institution overview tab. The rest of this tab shows the distribution of institutions by country (charts C and D) and by city (chart E). Charts F, G, H and I show distribution by field of study, specialty within field, sub-specialty and language respectively. Chart J shows distribution by credit level. Chart K provides an interactive list of institutions (with additional information provided in a popup window). Note: Information in charts F-J do not add up to 100% as in some cases more than one alternative is correct.
Points to note:
Tab 1 - Institution overview:
- The Americas, Europe and the Western Pacific are the top three WHO regions in terms of total number of institutions (select the ‘total’ button at the top left and view chart A).
- Low-income countries have the lowest median number of institutions per million people (0.20) compared to the other three income groups (0.73, 0.51, 0.37 in high, upper-middle and lower-middle income countries, respectively) (select the ‘median’ button at the top left and view chart B).
- Globally, 50.3% of institutions are privately funded, while 45.2% are publicly funded (chart D).
- Out of a total of 15,927 institutions globally, the vast majority (13,380; 84%) have existed for more than 20 years (reflecting institutional experience); of these, only a small percentage are in each of Africa (649; 4%) and the Eastern Mediterranean (750; 5%) regions. Only 1,286 (8%) are in South-East Asia (chart E).
Tab 2 - Distribution in relation to population:
- Total population per country and population density do not seem to influence the number of institutions (as data points are scattered across both charts A and B).
Tab 3 - Overview by speciality:
- The top three countries with the highest number of institutions are the United States of America (2,295), followed by Brazil (1,134) and China (1,082) (chart C). However, the top countries with the highest number of institutions per million people are Liechtenstein (51), San Marino (15) and Andorra (13) (chart D).
- In terms of cities, México (in Mexico) and Moscow (Russian Federation) are the top two cities with the highest number of institutions (112 and 82, respectively) (chart E).
- Selecting "health sciences" in chart F and looking at chart G, the top three specialities available are nursing and midwifery (5,275), followed by medicine (3,635) and rehabilitation and therapy (3,058).
- The most prevalent teaching language across all institutions is English (6,094; 38.3%), followed by Spanish (1,858; 11.7%) and Portuguese (1,294; 8.1%) (chart I).
- A total of 2,613 institutions worldwide (16.6%) include a public health discipline (select public health in chart G). Bogotá in Colombia has the highest numbers of institutions per city offering this discipline (chart C). 48.5% of institutions offering this discipline offer an advanced/postgraduate qualification (with research training) (point the cursor on the bar for this category in chart J).
To explore the data further
- In tabs 1 and 3, select a WHO region and/or income group (from the top charts) to filter countries according to these categories, or select a country, city, specialty or other dimension(s) to filter the data. More than one selection can be made to tailor the analysis as desired.
- --for example, in Tab 3, selecting the Africa region (chart A) and Madagascar (chart C, scroll as needed) shows than none of the 28 institutions in the country provide a postgraduate degree with research training (view chart J). Resetting the page choosing Nigeria, the country with the highest number of institutions in the Africa region (125), shows that 69 of the institutions (55.2%) provide and advanced/postgraduate qualification with research training (select Nigeria in chart C and view chart J).
- Hover the cursor on a bar, section in a pie or a symbol in a graphic to see more information in a popup window. (Note: hovering on the last column of chart K in tab 3, which provides the list of institutions, provides additional information such as the institutions’ website link and other relevant details.)
- Undo a selection by clicking ‘undo’ or ‘reset’ near the bottom of the page or by clicking the same element again.
Limitations of the data and analysis
- The analysis will be updated at regular time points but time lags with the scheduled updates by the data sources are inevitable. Accuracy and completeness of the information is the responsibility of the data source, see terms and conditions of use.