Benchmarking gross domestic R&D expenditure on health and medical sciences (health GERD) across countries against global targets
Published: February 2024
Data on gross domestic expenditure on R&D in the health and medical sciences (health GERD) are collected from the statistical office of the European Union (Eurostat), the Ibero-American and Inter-American Network of Science and Technology Indicators (RICYT), the Organisation for Economic Co-operation and Development (OECD), and the UNESCO’s (United Nations Educational, Scientific and Cultural Organization) Institute for Statistics (UIS)1.
Data on this indicator are reported using the most recent available data since 2010 by country (Note: not all countries have reported data on this indicator)
See also:
What you see
The data visualization explores how countries compare to each other in relation to their health GERD spending. Three questions are explored (one in each of the three tabs at the top of the page):
- Tab 1: How do countries compare on health GERD investments against global targets?
- Tab 2: Does controlling for local purchasing power of countries affect the amount of research that countries can buy?
- Tab 3: Does income level influence the % allocated to health GERD?
The two indicators used are:
- health GERD as % of GDP (top chart)
- health GERD as % of total GERD (bottom chart).
Benchmarks
Health GERD as % of GDP is compared to four benchmarks (0.05%; 0.10%; 0.15% and 0.20% of GDP) following the targets recommended by the 2012 Consultative Expert Working Group (CEWG) Report2, while health GERD as a % of total GERD is compared to three benchmarks (10%; 15% and 20% of total GERD arbitrarily set, informed by the data). Visualizations use a logarithmic scale on the x-axes.
Points to note:
- The data are derived from 85 countries for which data are available. They need to be interpreted cautiously, particularly due to the sporadic nature of the available data.
- The benchmarks for health GERD as % of GDP were originally set for government-funded research. For lack of breakdown of the health GERD data by source of funding, health GERD includes expenditures from all sources. These benchmarks are therefore conservative compared to the original aspiration for these targets.
- Based on available evidence, the data show large variations between countries. While a few countries exceeded the target for their income group, many countries did not meet the targets.
- Purchasing power parity (PPP) adjustment effectively shows that investments by low cost countries (i.e. in countries where research costs are low) go further in terms of the amount of research that they can buy compared to investments by high cost countries.
- There appears to be no relationship between income level and the proportion of GDP that countries allocate to health GERD.
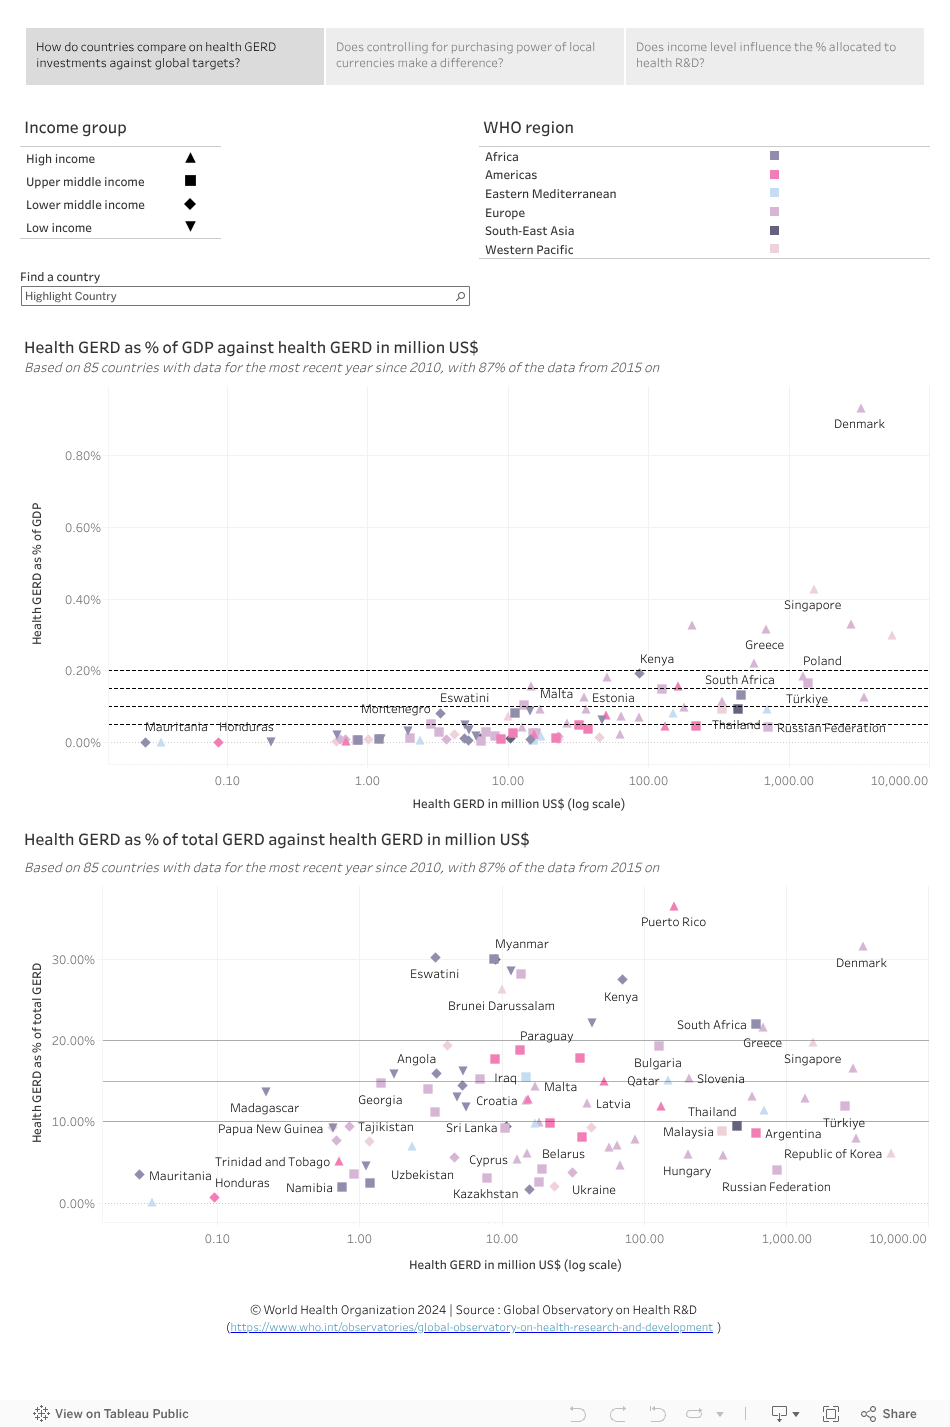
Tab 1: How do countries compare on health GERD investments (in million US$) against global targets?
Top chart (Health GERD as % of GDP compared to the four benchmarks listed above, shown as dashed horizontal lines):
- Health GERD as a % of GDP ranged from 0.00% to 0.93% for the reporting countries.
- 14 countries from three income groups exceeded the target for high-income countries (i.e. investing at least 0·15–0·20% of GDP on health GERD), including, for the countries with the most recent available data, Slovenia (0.33%), Greece (0.32%), the Republic of Korea (0.30%), Portugal (0.22%), Poland (0.19%) and Iceland (0.18%); interestingly Bulgaria (0.15%), one upper middle income country, is the only country in this income group to meet this target.
- Out of 32 high-income countries in the analysis, only 11 met or exceeded their target (click on the high-income country symbol on the key at the top left of the page).
- A few upper and lower middle-income countries exceeded the target for their income groups (i.e. investing at least 0·05–0·10% of GDP on health GERD), notably, for countries with the most recent available data, Türkiye (0.17%), Bulgaria (0.15%) and South Africa (0.13%). While several upper middle-income countries met their target, others, such as Serbia (0.02%), and Guatemala (0.01%) did not.
- Apart from Kenya, which exceeded the target, Eswatini (0.08%), a lower middle-income country, is the only country in this income group where health GERD as a % of GDP fell within the target range of 0·05–0·10%.
- Mozambique (0.09%), Ethiopia (0.06%) and Chad (0.05%) are the only three low-income countries to meet the target for their income group.
Bottom chart (health GERD as % of total GERD):
- Available data on health GERD as a % of total GERD show a wider diversity across countries, with several countries from all income groups exceeding the benchmarks. Puerto Rico (36.60%), Denmark (31.65%), Eswatini (30.25%) and Botswana (30.05%) are among the top countries for this indicator, allocating 30% or more of their total GERD to health.
Tab 2: Does controlling for local purchasing power of countries affect the amount of research that countries can buy?
The PPP adjustment accounts for price differences (i.e. differences in purchasing power of local currencies) and as such indicates how much research a particular country can ‘buy’ (assuming the PPP exchange rate also applies to the ‘price’ of research), using a hypothetical international currency, the PPP$. The PPP exchange rate reflects how much 1 US$ would buy in a country compared to the United States of America. The PPP adjustment increases GERD expenditures in PPP$ compared to US$ for countries with lower cost structures than in the United States of America and other high-income countries.
As can be seen in the top chart, the PPP adjustment increases GERD expenditures in PPP$ compared to US$ for countries with lower cost structures and brings the health GERD spending of these countries (often also lower income countries) closer to that of high-income countries. For example:
- Kenya (lower-middle income country) is closer to Qatar, Chile and Croatia (high-income countries) in the amount of research they buy.
- Ethiopia (US$ 46.61 mil. vs PPP$ 130.54 mil.), Mali (US$ 5.27 mil vs PPP$ 14.27 mil), Burundi (US$ 0.60 mil. vs PPP$ 1.72 mil.), and Madagascar (US$ 0.20 mil. vs PPP$ 0.69 mil.) can each buy around three times as much research in PPP$ than shown by the US$ figures (click on the low-income symbol on the key at the top left of the first and second tabs and hover with the mouse over the country name to see a popup window with the US$ (tab 1) and PPP$ (tab 2) values).
If PPP adjustment is believed to reflect cost differences in research (a mix of labour, infrastructure and technologies), this version of the analysis reflects better the relative spending on health GERD across countries against global targets.
Tab 3: Does income level influence the % allocated to health GERD?
- Both the top and bottom charts suggest that there is no relationship between income level and the amount of money allocated to health GERD.
- For example, in the top chart Kenya (a lower middle-income country), is among the top countries to spend more than 0.15% of GDP on health GERD – joining Denmark, Singapore, Slovenia, Netherlands (Kingdom of the), Greece, Republic of Korea, Portugal and Poland (which are high-income countries).
- Several high-income countries do not meet the target of spending between 0.15-0.20% of their GDP on health GERD. Notably, this includes several high-income countries from the European and Eastern Mediterranean regions (click on the symbol for high-income countries at the top left of the page to filter for this income group).
To explore the data further
- Select a WHO region (from the top right key) and/or income group (from the top left key) to filter countries according to these categories, or select a country from the ‘Find a country’ dropdown list. Use your control key to select more than one category.
- Hover the cursor over a symbol in a graphic to see more information in a popup window (e.g. income group, heath GERD, health GERD as % of GDP – depending on the chart being viewed).
- Undo a selection by clicking ‘undo’ or ‘reset’ near the bottom of the visualization or by clicking the same element again.
Data sources
1 Data from UNESCO Institute for Statistics (UIS) was last updated by the source in March 2021
2 The 2012 Consultative Expert Working Group on Research and Development: Financing and Coordination made the following recommendations for global targets to increase investments on health R&D which were the basis of the benchmark lines in the top chart:
- Developing countries with potential research capacity should aim to commit 0.05–0.1% of their GDP to government-funded health research of all kinds.
- Developed countries should aim to commit 0.15–0.2% of their GDP to government-funded health research of all kinds.