Gross domestic R&D expenditure on health (health GERD) as a % of total GERD
Published: June 2025
The gross domestic expenditure on R&D in the health and medical sciences (health GERD) are collected from the statistical office of the European Union (Eurostat), the Ibero-American and Inter-American Network of Science and Technology Indicators (RICYT), the Organisation for Economic Co-operation and Development (OECD), and the UNESCO's (United Nations Educational, Scientific and Cultural Organization) Institute for Statistics (UIS)1. They are reported below using the most recent available data since 2010 by country (Note: not all countries have reported data on this indicator).
See also:
What you see
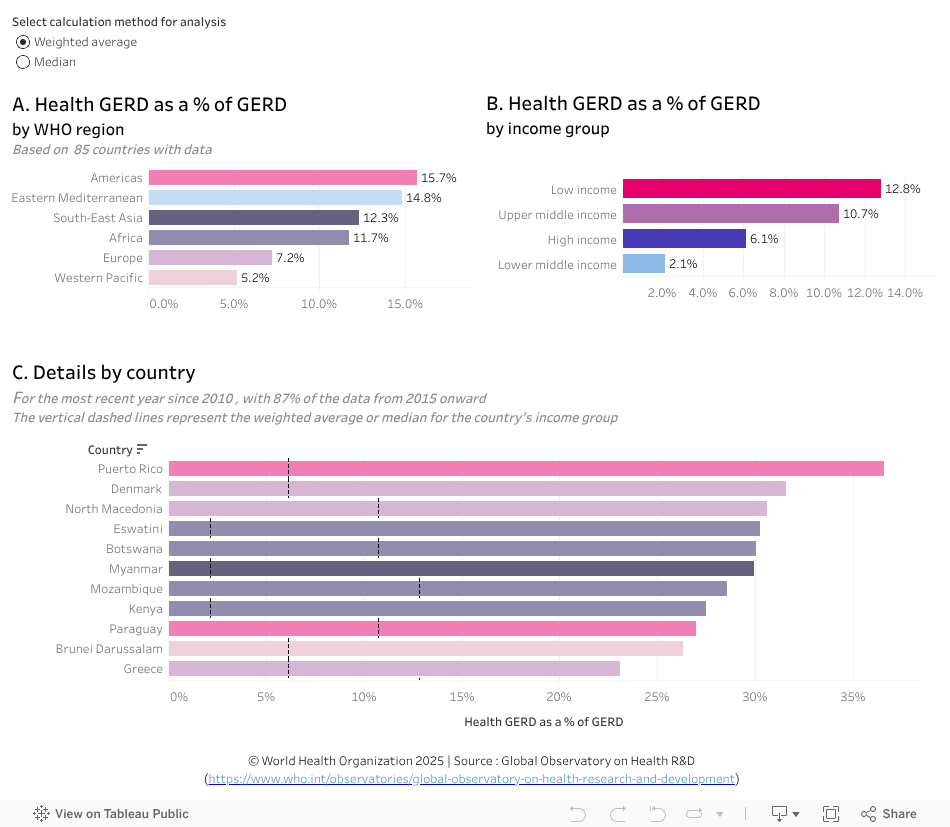
The data visualization compares health GERD by country as a % of total GERD. The regional weighted averages and medians are provided by WHO region and by country income groups (charts A and B). (To see the data using either of the two calculation methods, select the desired method from the two options above the charts).
Points to note:
- The regional weighted averages and medians are derived from 85 countries for which data are available. They need to be interpreted cautiously because of the number of missing observations. Data used are the most recent available since 2010, with 87% of them from 2015 onward.
- The regional weighted average health GERD as % of total GERD varies between 5.2% (Western Pacific) and 15.7% (Americas), while the median varies between 9.2% in Western Pacific and 14.4% in Africa (chart A).
- Low income countries allocated the highest % of their GERD to health, on average – 12.8% compared to the lowest (2.1%) in lower-middle income countries. The median values across all income groups showed less variation however, between 13.7% (low income) to 9.2% (lower-middle income) (chart B).
- Comparisons in the percent allocation between this year and last year’s analysis is best done in conjunction with the actual amounts spent to have a full picture of the change from year to year.
- Health GERD compared to all GERD is relatively stable with the same amounts in most regions, and a slight increase in spend in UMIC from 8.89% to 10.7%.
- The region of the Americas showed the highest increase in the weighted average once again for health GERD as % of total GERD (15.7%) compared to the previous analysis (13.7%). This can be explained by the general increase in the amounts of health GERD reported in this region; with the highest increase reported by Panama (from US$ 0.18 million in 2017 to US$ 26.7 million in 2025). Paraguay has increased 19% to 27%, Costa Rica 18% to 21%, Panama 13% to 19% . Guatemala has however seen a massive decrease from 18% (US$ 8.9 million) to 1% (US$ 0.1 million) (point the cursor on the relevant country bar in chart C and see information in the popup window.)
- In Europe a slight increase overall, from 6% to 7.2%, including Croatia increasing spend from 13% (14 million USD) to 16% (22 million USD)
- Low income countries continue to spend the most of their R&D capacity on Health R&D, while lower middle income countries spend the least on average, although this hides the fact that some LMIC spend significantly with over 25% of their R&D budget on health (Eswatini, Myanmar and Kenya)
To explore the data further
To explore by country estimates and differences with regional averages or medians (in chart C --the regional average or median is symbolized by a vertical dashed line, depending on the calculation method selected):
- Select a region and/or income group in the top charts to filter countries according to those categories.
- For example, selecting only Africa (chart A), shows that Eswatini, Botswana, Mozambique, and Kenya allocated a % of GERD to health over two times higher (29%–30%) than the regional weighted average (11.7%) and more than their respective income group average (see vertical dashed line).
- After selecting a region, you can select an income group (chart A), which will filter the countries belonging to this income group within this region.
- For example, selecting low-income countries within Africa (already selected in the previous step) shows that six out of nine countries in that income group exceeded the average health GERD as % of total GERD for low income countries in Africa (12.8%) with Mozambique on the top of the list at 29% ( hover on a country in chart C and see information in the popup window).
- Hover the cursor on a bar in a graphic to see more information in a popup window (year, total GERD in local currency, health GERD in local currency, health GERD as % of total GERD, regional/income level averages).
- Undo the selection by selecting ‘undo’ or ‘reset’ near the bottom of the visualization or by selecting the same element again.
Data sources
1 Data from UNESCO Institute for Statistics (UIS) was last updated by the source in March 2021
Previous versions
February 2024| April 2023 | December 2021 | January 2021 | January 2020 | October 2018 | January 2018 | January 2017