Gross domestic R&D expenditure on health (health GERD) as a % of total GERD
The gross domestic expenditure on R&D (GERD) and GERD in the health and medical sciences (health GERD) are collected from the United Nations Educational, Scientific and Cultural Organization (UNESCO), the Organisation for Economic Co-operation and Development (OECD) and Eurostat, the statistical office of the European Union. They are reported below using the most recent available data since 2010 by country (Note: not all countries have reported data on this indicator).
See also:
What you see
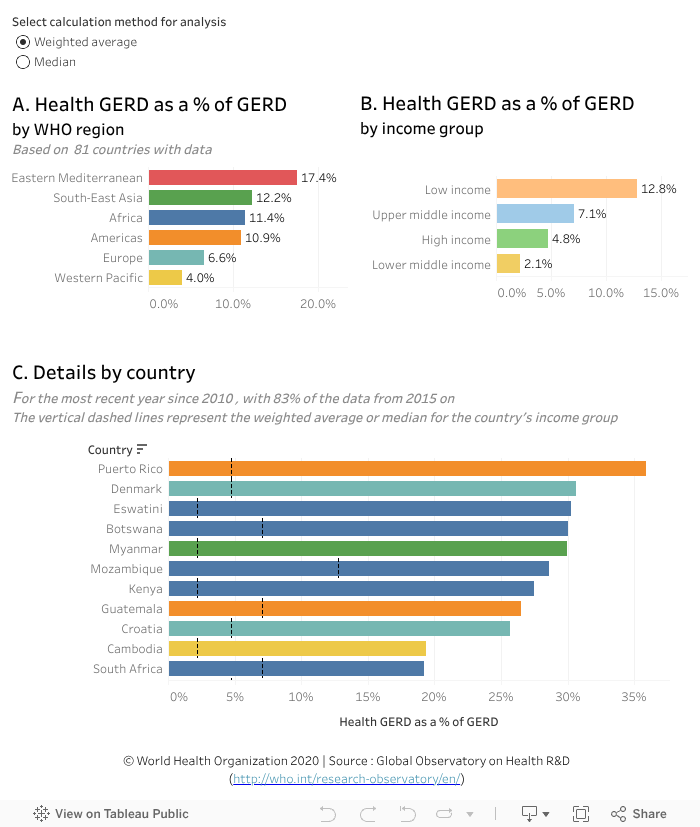
The data visualization compares health GERD by country as a % of total GERD. The regional weighted averages and medians are provided by WHO region and by country income groups (top charts). (To see the data using either of the two calculation methods, select the desired method from the two options above the charts).
Points to note:
- The regional weighted averages and medians are derived from 81 Member States for which data are available. They need to be interpreted cautiously because of the number of missing observations. 83% of the data are from 2015-2018, the remaining 17% are for the most recent year with data since 2010.
- The regional weighted average health GERD as % of total GERD varies between 4% (Western Pacific region) and 17.4% (Eastern Mediterranean), while the median varies between 7.5% in Europe and 15% in Africa (Chart A).
- Low income countries allocated the highest % of their GERD to health, on average – 12.8% compared to the lowest (2.1%) in lower-middle income countries. The median values showed less variation however, between 13.7% (low-income) to 7.1% (upper-middle income) (Chart B).
To explore the data further
To explore by country estimates and differences with regional averages or medians (in Chart C --the regional average or median is symbolized by a vertical dashed line, depending on the calculation method selected):
- Select a region and/or income group in the top charts to filter countries according to those categories.
--For example, selecting only Africa (Chart A), shows that Eswatini, Botswana, Mozambique, Kenya and South Africa allocated a higher % of GERD to health (19%–30%) than the regional weighted average (11.4%) and their respective income group average (see vertical dashed line). - After selecting a region, you can select an income group (Chart A), which will filter the countries belonging to this income group within this region.
- -- For example, selecting low income countries within Africa (already selected in the previous step) shows that six out of eight countries in that income group exceeded the average health GERD as % of total GERD for low income countries in Africa (12.8%) with Mozambique on the top of the list at 29% ( hover on a country in chart C and see information in the popup window).
- Hover the cursor on a bar in a graphic to see more information in a popup window (year, total GERD in local currency, health GERD in local currency, health GERD as % of total GERD, regional/income level averages).
- Undo the selection by selecting ‘undo’ or ‘reset’ near the bottom of the visualization or by selecting the same element again.