Official development assistance (ODA) for medical research and basic health sectors as a % of gross national income (GNI) and as a % of all ODA, by donor country
Published: March 2023
Data on the official development assistance (ODA) for medical research and basic health sectors (health ODA) and ODA as % of gross national income (ODA as % GNI) are collected from the Organization for Economic Co-operation and Development (OECD) and are reported for the year 2021 by donor country (not all countries have reported data on this indicator)
See also:
What you see
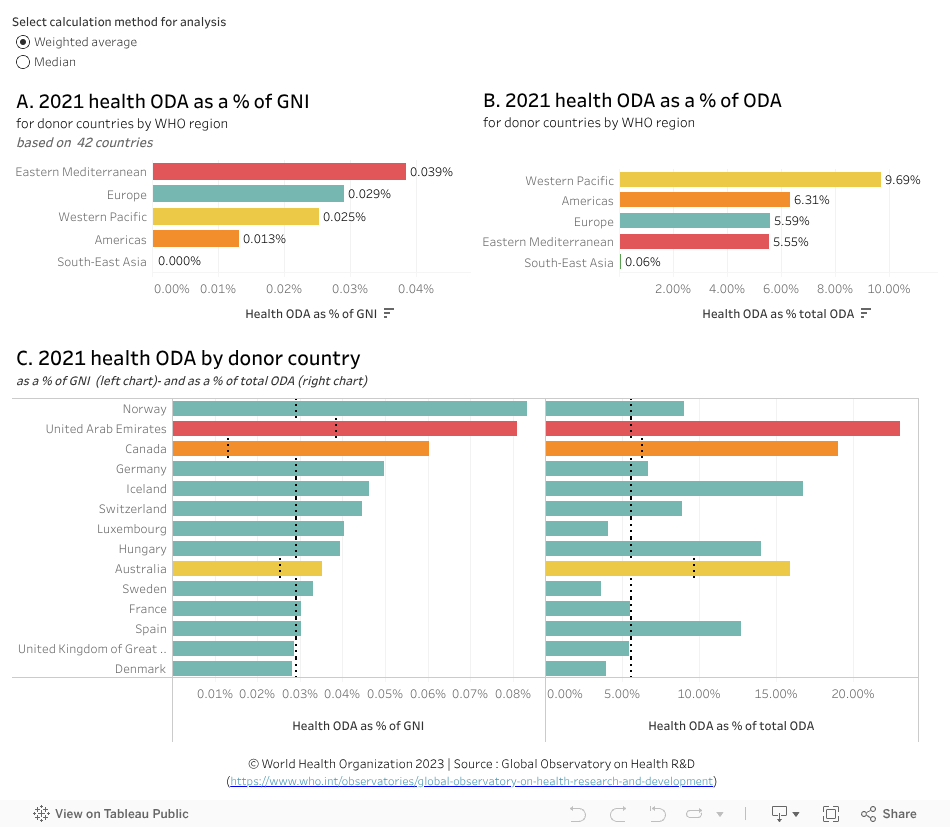
The data visualization compares 2021 health ODA by donor country as a % of GNI (chart C, left) and as a % of total ODA (chart C, right). The regional weighted averages and medians are provided in chart A and chart B.
Points to note:
- The information about health ODA is derived from 42 Member States for which data are available.
- The Eastern Mediterranean region has the highest weighted average of health ODA as a % of GNI followed by the European region (0.039% and 0.029% respectively; chart A), while the region of the Western Pacific has the highest weighted average health ODA as a % of total ODA (9.69%; chart B) when compared to other regions for the reported period and donor countries.
- However, if using the median values, the European region comes second to last for both indicators (health ODA as a % of GNI (0.017%) and as a % of total ODA (5.51%) compared to the other regions for the reported period and donor countries (chart A and chart B). The difference observed for the European region is accounted for by the wide range in both the amount of health ODA, and the total ODA, donated by countries in this region.
To explore by country estimates and compare with regional averages (the regional weighted average is symbolized by a vertical dashed line)
- Select a region in chart A or chart B to filter countries according to those categories and then examine the data in chart C. For example:
--Selecting only the region of the Western Pacific (in either chart A or chart B), shows that Australia exceeded the regional weighted average and the median for both health ODA as a % of GNI (0.04%) and health ODA as a % of total ODA (15.93%).
--Selecting only Europe (in either chart A or chart B, shows that of the countries exceeding the regional weighted average of 0.029% for health ODA as % of GNI (chart C, left), Norway allocated the highest share of health ODA as a % of GNI (0.08%). This is approximately three times the regional weighted average and five times the median (0.017%). Croatia had the highest health ODA as % of total ODA (18.84%; chart C, right). This represents three times the regional weighted average of 5.59% and three times the median of 5.51%. - Hover the cursor on a bar in a graphic to see more information in a popup window.
- Undo the selection by clicking ‘undo’ or ‘reset’ near the bottom of the page or by clicking the same element again.
Previous versions
April 2022 | February 2021 | April 2020 | January 2019 | January 2018 | January 2017